When a search has been initiated or a saved case requested, the screen will refresh and display the Graph tab containing a graphical display of the analysis results. The search criteria will appear along with any linked data found in the database.
The analysis brings back structured data from agency records management systems, as well as unstructured data or documents that contain the analysis criteria.
The following applies to the Link Analysis Graph when one or more Remote Systems are selected:
1. After performing a Link Analysis search, all results (local and remote) returned within the designated threshold - which begins when the first results are returned - will be available to the user. When any additional results that were not available within the designated time threshold become available, the Merge Results button will be activated, and the status indicator will tun green (see Results Management Status Description section below).
2. When the agency type is not known to LInX, line color for the remote system results will default to black.
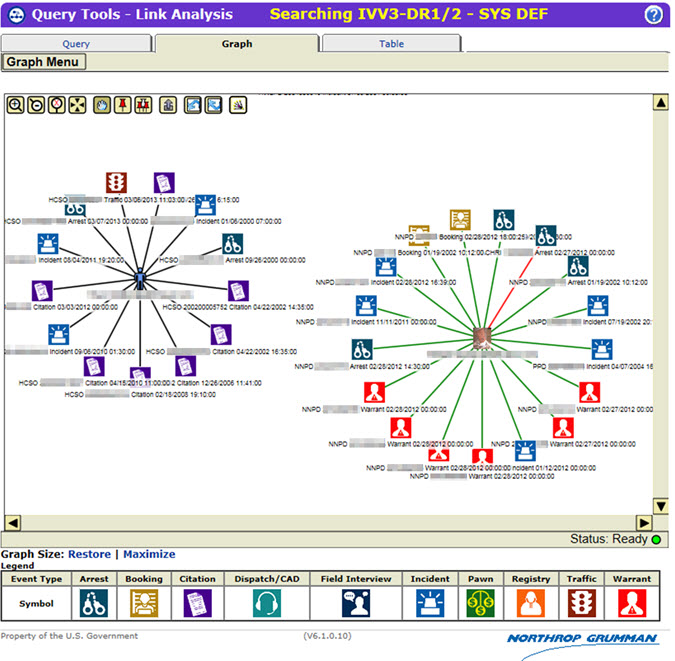
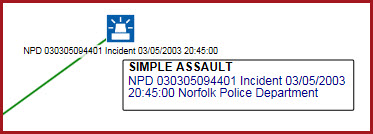
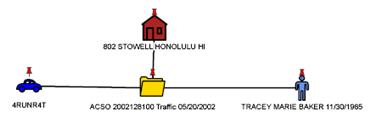
An example of a Link Analysis Graph with structured data is shown below:
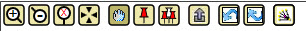
A legend at the bottom of the Graph denotes the icons associated with the specific event types.
v Icons representing entities other than event type include:

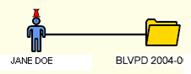
If a mug shot is available for an individual, the mug shot will appear in place of the people icon.
A Results Management Status is displayed beneath the menu bar on the left side of the screen. The Status contains the name of the neighborhood that was searched, the name of each system and/or Partner contained in the neighborhood, and the number of matching nodes retrieved from each system within the designated time threshold, which begins when the first results are returned.
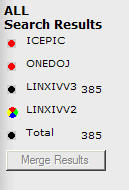
Search results from one or more remote systems or Partners will automatically be merged and displayed in the LInX search result set, if they are available within the results management time threshold.
If the search of a system has not been completed within the time threshold, a visual indicator will denote the status of that search. The visual indicator status legend is as follows:
Ø Black - The search of the system was successfully completed within the time threshold, and all results have been returned.
Ø Red - An error occurred while attempting to search the system (e.g., search timed out).
Ø Green - The search of the system was completed after the time threshold was exceeded. Results from the search are now available and ready to be merged into the current result list.
Ø Multi-colored "beach ball" - Waiting for results, as the search of the system is still in progress.
Hovering the mouse over each visual indicator will display a pop-up containing the status description.
Note: When data is "walked" or "unwalked", the Results Management Status will update automatically to account for the addition or deletion of nodes on the chart.
Merge Results
When there are results available to be merged, denoted by a green indicator next to the system name, the additional records can be manually merged into the current results set by clicking on the Merge Results button, which is highlighted to show it is available.
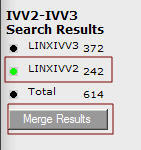
After the Merge Results button has been selected, the visual indicator next to the system name will turn from green to black, and the number of nodes in the result set will update accordingly, to account for the inclusion of the additional records. The Merge Results button will no longer be highlighted.
Note: Unless the Merge button is used, all results will not be transferred/moved to the results list. |
Each icon is identified by a label containing a name and description or number identifier. By placing the cursor over the icon, additional information will appear:
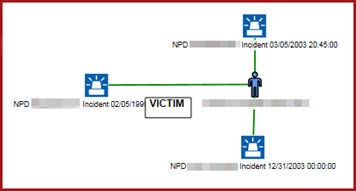
Placing the cursor over the lines connecting the icons will show additional information on the nature of the connection. For example, the line between a person icon and an event report will show the role the person plays in the report:
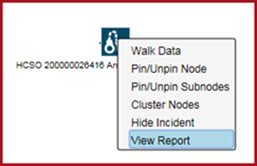
Documents (unstructured data) will appear separately as event folders on the graph. Link Analysis searches through the documents and brings back any document containing the search criteria, which may or may not be related to the structured or event report information. To access the document, right-click on the folder icon, then select View Report from the pop-up menu.
An Event Report opens in a separate window. The unstructured data can be viewed in the Narrative section of the Event Report by scrolling down to the bottom of the Event Report window.
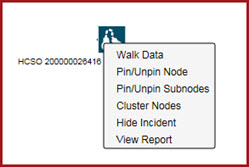
Some functions can be accessed by right-clicking on the icons and selecting a function from the shortcut menu, which will display the functions that are appropriate for the particular icon:
Tip: Graph functions can be performed by selecting function "buttons" or by right-clicking on an entity on the graph to activate shortcut menus.
Right-clicking on the white space of the graph will also bring up a shortcut menu reflecting general graph functions, such as zooming options. |
The appearance of the graph can be changed and the analysis can be expanded by using the graph function buttons located at the top left part of the graph:
With the exception of the ”zoom” buttons, when buttons are in use, they will be shaded to indicate the function is still active. Clicking the button again will release the function.
Right-clicking on the white space of the graph will also bring up a shortcut menu reflecting general graph functions, such as zoom in or out:
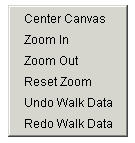
By selecting the appropriate graph function button, the graph’s appearance can be changed by altering the size of the graph, centering results, and moving icons around the screen.
Changing Overall Chart Size:
Selecting the Zoom In button will increase the size of the graph on the screen.
![]()
Selecting the Zoom Out will cause the graph to decrease in size.
![]()
Return Graph Size:
The Zoom Reset button can be selected to return the graph to the original appearance after changing the size or after centering icons. It will not return the original graph if icons have been ”dragged” and moved.
![]()
Centering the Icons:
The Center at Point button will bring graph results to the center of the graph. The button should be selected and the cursor placed on the key icon to be centered; all linked icons will be moved as well. Clicking on the button again will de-activate it.
![]()
Moving Icons:
To move icons, the ”Drag” button should be selected and the cursor placed over an icon to move it to another location on the graph. This button will automatically be turned on when the graph first appears. Clicking on the button again will de-activate it.
![]()
Reorganize Chart:
The Reorganize Chart will redraw the chart after entities have been walked.

One or more nodes can be ”pinned” in place on the graph so they do not move, even if other nodes on the graph are moved. This allows the user to hold some data in place while other data is moved around it. Two ”pinning” functions are provided in Link Analysis SVG:
Pin/Unpin Nodes
Any
node can be pinned in place so that it does not move, even if other nodes
on the graph are moved. To pin an individual node, first click
on the Pin/Unpin to Location button
[![]() ] to activate it, then click the node
to be pinned. A pin will be placed in the center above the selected
node.
] to activate it, then click the node
to be pinned. A pin will be placed in the center above the selected
node.
Clicking on the node again will remove the pin. This function can also be accessed by right-clicking the node and selecting Pin/Unpin Node from the shortcut menu.
To unpin a node, with the Pin/Unpin to Location button highlighted, left-click on the pinned node again to remove the pin.
Alternatively, an icon can be unpinned by right-clicking on the icon and selecting Pin/Unpin Node from the shortcut menu.
The Pin/Unpin to Location button must be un-highlighted to deactivate the function.
Pin/Unpin Sub-nodes
This
function allows the user to simultaneously pin an Event node (folder icon)
and any sub-nodes to which it is directly linked. To do this, first
click on the Pin/Unpin All to Location
button [![]() ] to activate it,
then click the Event node to be pinned. A pin will be placed in
the center above the selected Event node, as well as all other nodes directly
linked to that Event.
] to activate it,
then click the Event node to be pinned. A pin will be placed in
the center above the selected Event node, as well as all other nodes directly
linked to that Event.
Clicking on the Event node again will remove the pins from the primary node and all sub-nodes. This function can also be accessed by right-clicking the Event node and selecting Pin/Unpin Sub-nodes from the shortcut menu.
To unpin the Event node and all sub-nodes, with the Pin/Unpin All to Location button highlighted, left-click on the pinned event node again to remove the pins.
Alternatively, a pinned event node and connected sub-nodes can be unpinned by right-clicking on the icon and selecting Pin/Unpin Sub-Nodes from the shortcut menu.
The Pin/Unpin All to Location button must be un-highlighted to deactivate the function.
An individual sub-node can be unpinned while leaving the remaining sub-nodes pinned by following the Pin/Unpin Node directions above.
Event nodes (folder icons) can be ”walked”, or expanded to display additional node types associated with the Event, such as People, Vehicles, Weapons, Addresses, and Phones.
Any node can be walked, although
all nodes do not have additional associations. To walk a node, select
(highlight) the node to be walked, then click on the Walk
Data button [![]() ] on the
tool bar. This function can also be accessed by right-clicking on
the node to be walked, and selecting Walk
Data from the shortcut menu. The additional associated nodes
will be displayed on the graph, if available, and added to the node Table.
Any number of nodes can be walked.
] on the
tool bar. This function can also be accessed by right-clicking on
the node to be walked, and selecting Walk
Data from the shortcut menu. The additional associated nodes
will be displayed on the graph, if available, and added to the node Table.
Any number of nodes can be walked.
To undo the most recent walk
operation, either select the Undo Walk
Data button [![]() ] on the
tool bar, or right-click in any white space on the graph, and select Undo Walk Data from the shortcut
menu. The most recent nodes displayed as a result of a Walk
Data operation will be removed from the graph and in the node Table.
] on the
tool bar, or right-click in any white space on the graph, and select Undo Walk Data from the shortcut
menu. The most recent nodes displayed as a result of a Walk
Data operation will be removed from the graph and in the node Table.
This option is only effective when there is at least one set of walked data present. Multiple walked data can be undone, in reverse sequence, starting with the most recent data walked and moving as far back as the first Walk Data operation of the current result graph.
To redo the most recent Walk Data operation, either select
the Redo Walk Data button [![]() ] on the tool bar, or right-click in any
white space on the graph, and select Redo
Walk Data from the shortcut menu. The most recent nodes removed
from the graph as a result of an Undo
Walk Data operation will be re-displayed on the graph and in the
node Table.
] on the tool bar, or right-click in any
white space on the graph, and select Redo
Walk Data from the shortcut menu. The most recent nodes removed
from the graph as a result of an Undo
Walk Data operation will be re-displayed on the graph and in the
node Table.
This option is only effective when there has been at least one Undo Walk Data operation performed. Multiple walked data can be re-walked, progressing forward from the last Undo Walk Data operation performed through each successive Undo Walk Data of the current result graph.
Any node can be hidden from view on the graph either by right-clicking the node to be hidden, and selecting Hide <node type> from the shortcut menu (where <node type> is the type of the node to be hidden); or deselecting the Show box for the specific node from the node Table, then returning to the Graph tab.
Any hidden node can be re-displayed on the chart by re-selecting the Show box for the specific node from the node Table, then returning to the Graph tab.
The Event Report for an event
can be viewed by selecting the View Report
button [![]() ] on the tool bar.
] on the tool bar.
The Event Report is displayed in a separate window, and contains Incident, Warrant, Person, Vehicle, Phone, and Narrative information, as applicable, associated with the selected event.
This function can also be accessed by right-clicking an Event node (folder icon) and selecting View Report from the shortcut menu.
Printing the Event Report
To print an Event Report from LInX, open the desired report, and click the Print button in the lower right-hand corner of the Event Report window. If the Printing from LInX user agreement has not been accepted, the user agreement will be presented to the user. If the user selects I Do Not Agree, a pop-up window is displayed stating ”You need to accept the Printing From LInX agreement.” Click OK to close the window.
Once the Printing from LInX user agreement has been accepted, a separate PDF window opens, containing the selected Event Report. The banner at the top of each page displays the following information:
Name of the LInX user requesting the printout
The LInX User ID of the user requesting the printout
The Site, System, and Agency to which the user belongs
The date and time the printed/saved report is to be destroyed
A statement that the printout is for temporary use only
The bottom of each page displays the following information:
Disclaimer describing the Rules of Use for saving and/or printing the Event Report from LInX
LInX version number
Page number and total number of pages
Date and Time the Event Report was requested to be printed/saved
To print
the Event Report, click on the
printer icon [![]() ] at the top of the PDF window
to open a Print window, and click
OK to print the report. The
PDF window can be closed after the report has been printed.
] at the top of the PDF window
to open a Print window, and click
OK to print the report. The
PDF window can be closed after the report has been printed.
To save the
Event Report, click on the disk
icon [![]() ] at the top of the PDF window to
open a Save a Copy window,
enter a file name, and click Save
to save the report. The PDF window can be closed after the file
has been saved.
] at the top of the PDF window to
open a Save a Copy window,
enter a file name, and click Save
to save the report. The PDF window can be closed after the file
has been saved.
Printed or saved output is for temporary use only; it must be destroyed within 72 hours of being obtained. |
Printing Photos
The photos included with an Event Report can be printed in LInX. If there is only one photo associated with a person, it can only be printed when the Event Report is printed. If there are additional photos associated with a person, click on the More Images link under the image. This will open the photos in a separate window.
To print photos, click the Print button in the lower right-hand corner. If the Printing from LInX user agreement has not been accepted, the user agreement will be presented to the user. If the user selects I Do Not Agree, a pop-up window is displayed stating "You need to accept the Printing From LInX agreement.” Click OK to close the window.
If the Printing from LInX user agreement has been accepted, a separate PDF window opens, containing all the photos (one photo per page) associated with the event. The banner at the top of each page displays the following information:
Name of the LInX user requesting the printout
The LInX User ID of the user requesting the printout
The Site, System, and Agency to which the user belongs
The date and time the printed/saved photos are to be destroyed
A statement that the printout is for temporary use only
The bottom of each page displays the following information:
Disclaimer describing the Rules of Use for saving and/or printing photos from LInX
LInX version number
Page number and total number of pages
Date and Time the photos were requested to be printed/saved
To print
the photos, click on the printer icon [![]() ]
at the top of the PDF window to open a Print
window, and click OK to print
the photos. The PDF window can be closed after all photos have been
printed.
]
at the top of the PDF window to open a Print
window, and click OK to print
the photos. The PDF window can be closed after all photos have been
printed.
To save the
photos, click on the disk icon [![]() ]
at the top of the PDF window to open a Save
a Copy window, enter a file name, and click Save
to save the photos. The PDF window can be closed after the file
has been saved.
]
at the top of the PDF window to open a Save
a Copy window, enter a file name, and click Save
to save the photos. The PDF window can be closed after the file
has been saved.
Printed or saved output is for temporary use only; it must be destroyed within 72 hours of being obtained. |
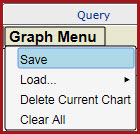
Current graph results can be saved for future access. A graph saved in Link Analysis SVG can be reused in either Link Analysis SVG or Link Analysis I2.
To save the current graph results, select Save from the Graph Menu, located below the Query tab label.
In the Enter Case Name text box, enter the name under which the graph will be saved, then select OK.
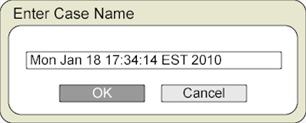
Note: The default name, consisting of the date and time, may be used, or a more descriptive name may be entered.
To access a previously saved graph, select Load from the Graph Menu, located below the Query tab label, and highlight the desired graph from the list.
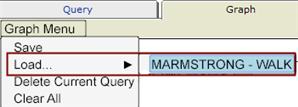
The window will be re-displayed with the results of selected graph.
The currently saved graph can also be deleted by selecting Delete Current Query from the Graph Menu, located below the Query tab label.
A message window will appear asking the user if the named chart is to be deleted. Selecting Cancel will generate another message window stating that the named chart is not deleted. Press OK to close the message window.
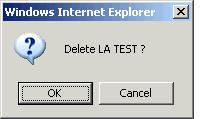
Selecting OK will generate another message window stating that the named chart has been deleted. Press OK to close the message window. The chart screen will refresh with a blank screen.
Tactical and Analytical users should contact their System Administrator or Agency Administrator when they are having problems accessing or using LInX. Only System Administrators are authorized to contact the LInX Help Desk.